MTM home
MultiTaper F-test
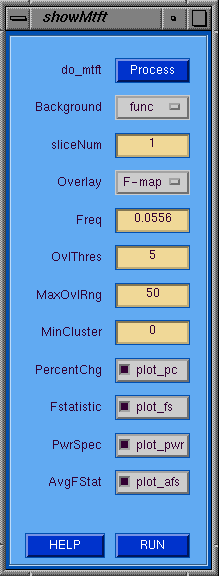
The showMtft GUI allows the user display the results
(i.e. f-Value, magnitude or phase) of a multitaper f-test
for a particular frequency as an overlay map on top of the
corresponding slice of either the functional or anatomic
data.  The overlay map is color coded along a scale from
the threshold value to the MaxOvlRng.  Those pixels who
belong to a cluster with a size smaller than the MinCluster
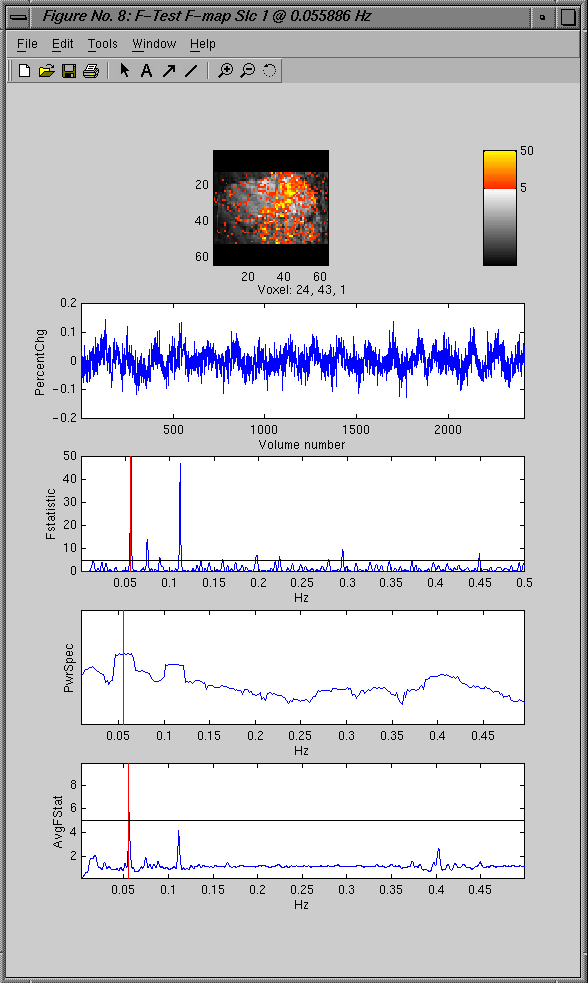
are not shown in the map.  If the PercentChg Plot option is
selected, then when the image is clcked by the mouse the
underlying time series is plotted along with optionally
the Fstatistic and power spectrums and/or the average
F-statistic over all pixels.
showMtft GUI Tips
- do_mtft --> Popup the multi-taper F-test processing window.
- Background --> Type of image for background.
- sliceNum --> Slice number to display.
- Overlay --> Type of image for overlay.
- F_freq --> F-test Frequency to display.
- F_thres --> Threshold value for F-stat mask.
- MinOvlRng --> Minimun display value for scaling overlay.
- MaxOvlRng --> Maximun display value for scaling overlay.
- MinCluster --> Minimum cluster size for overlay display.
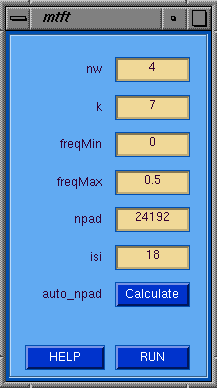
The mtft GUI allows the user to specify the mtft parameters
and invoke the calculation by pressing the RUN button.
An appropriate npad can be automatically calculated based
on the isi by pressing the auto_npad calculate button.
mtft GUI Tips
- nw --> Slepian Time-Bandwidth product.
- k --> Number of Slepian tapers (usu. 2nw-1)
- freqMin --> Minimum frequency of f-test calculation.
- freqMax --> Maximum frequency of f-test calculation.
- npad --> DFT zero paddding.
- padFactor --> Multiplication factor to determine npad.
- isi --> Inter-stimulus interval in volAcq units.
- auto_npad --> Calculate adequate npad.
Relative URL:/~strupp/mtm_doc/freqFtest.shtml
Last modified: Thursday, 03-Jan-2002 14:44:41 CST


