MTM home
Map Compare
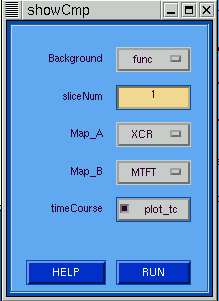
The showCmp GUI allows the user display a comparison
between the resulting maps from any pair of activation
maps previously calculated. When the user presses the
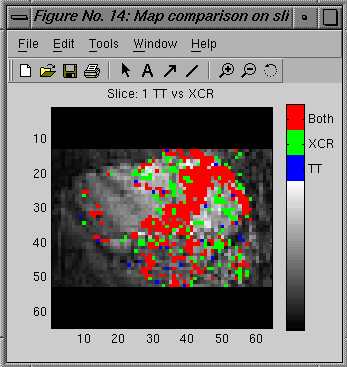
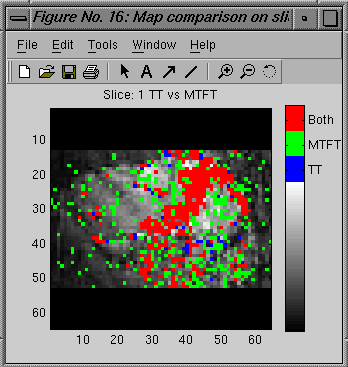
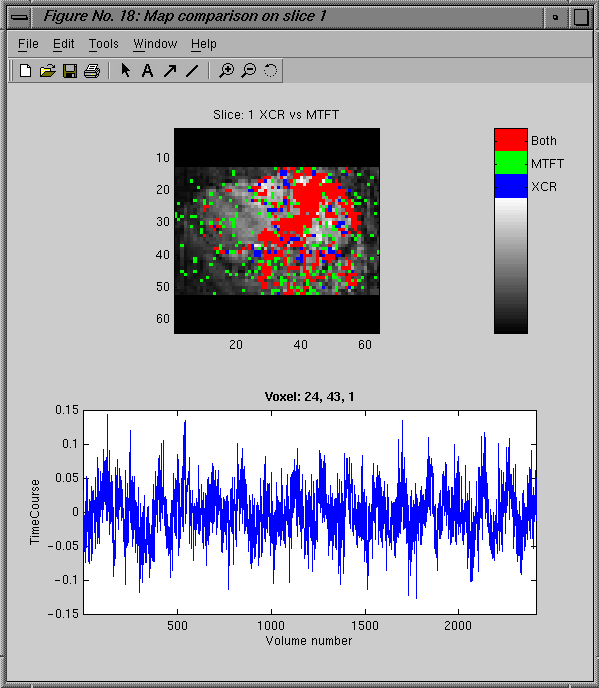
RUN button, a comparison map is calculated and displayed.
The comparison map is color coded to indicate at each
pixel whether there was activation in the first map,
the second map or in both maps. If the timeCourse Plot
option is selected, then when the image is clcked by the
mouse the underlying time series is plotted.
showCmp GUI Tips
- Background --> Type of image for background.
- sliceNum --> Slice number to display.
- Map_A --> Map A selection.
- Map_B --> Map B selection.
Relative URL:/~strupp/mtm_doc/map_cmp.shtml
Last modified: Thursday, 03-Jan-2002 14:47:19 CST