MTM home
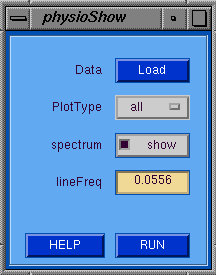
physioShow
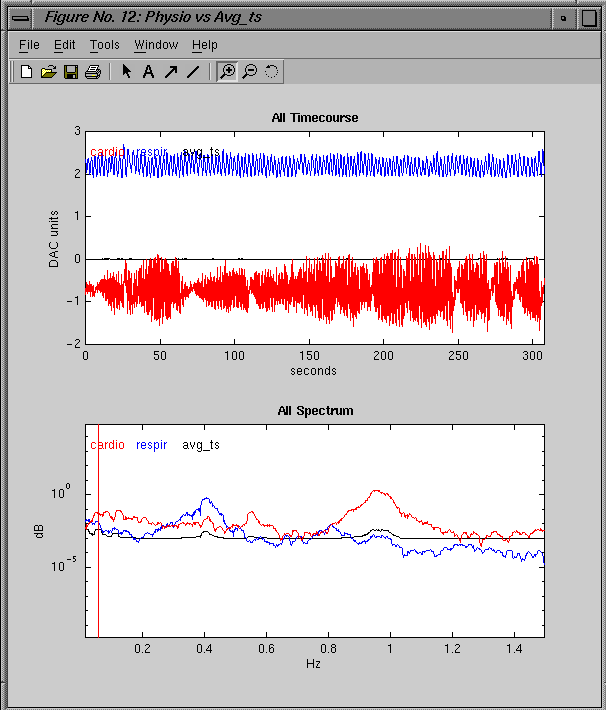
The physioShow GUI is used to load and display the
physiologic timecourses and average functional timecourse.
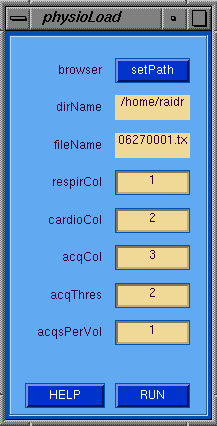
First the Load button must be pressed to popup the
physioLoad GUI for loading of the physiologic data.
The PlotType menu allows the user to specify plotting
of cardio, respir, average functional time series or all
three of them. When spectrum check box is selected, the
corresponding spectrum is also plotted. Note that the
spectrum of the time series average is the "average of
the time series' spectrums" and NOT the "spectrum of the
average time series". For reference, a vertical line is
plotted at the frequency specified in the field lineFreq.
physioShow GUI Tips
- Data --> Popup physioLoad window.
- PlotType --> Type of data to plot.
- lineFreq --> Frequency at which to draw a line in the spectrum.
Relative URL:/~strupp/mtm_doc/physioShow.shtml
Last modified: Thursday, 03-Jan-2002 14:20:25 CST