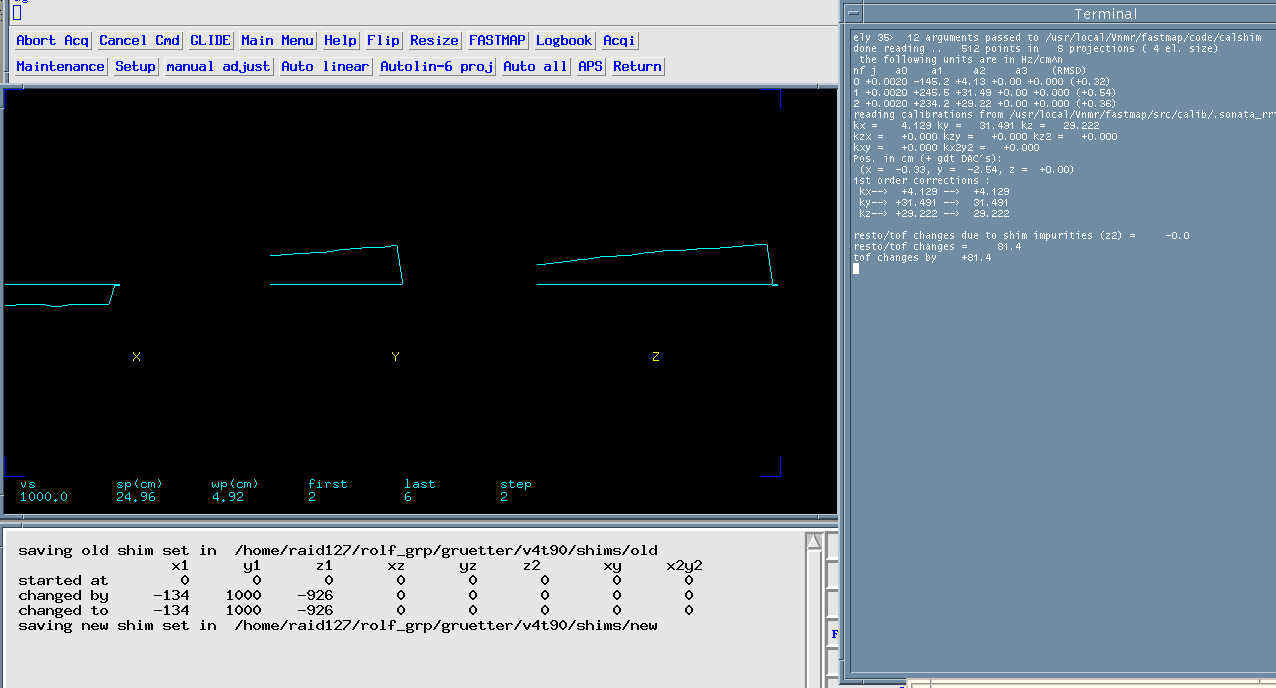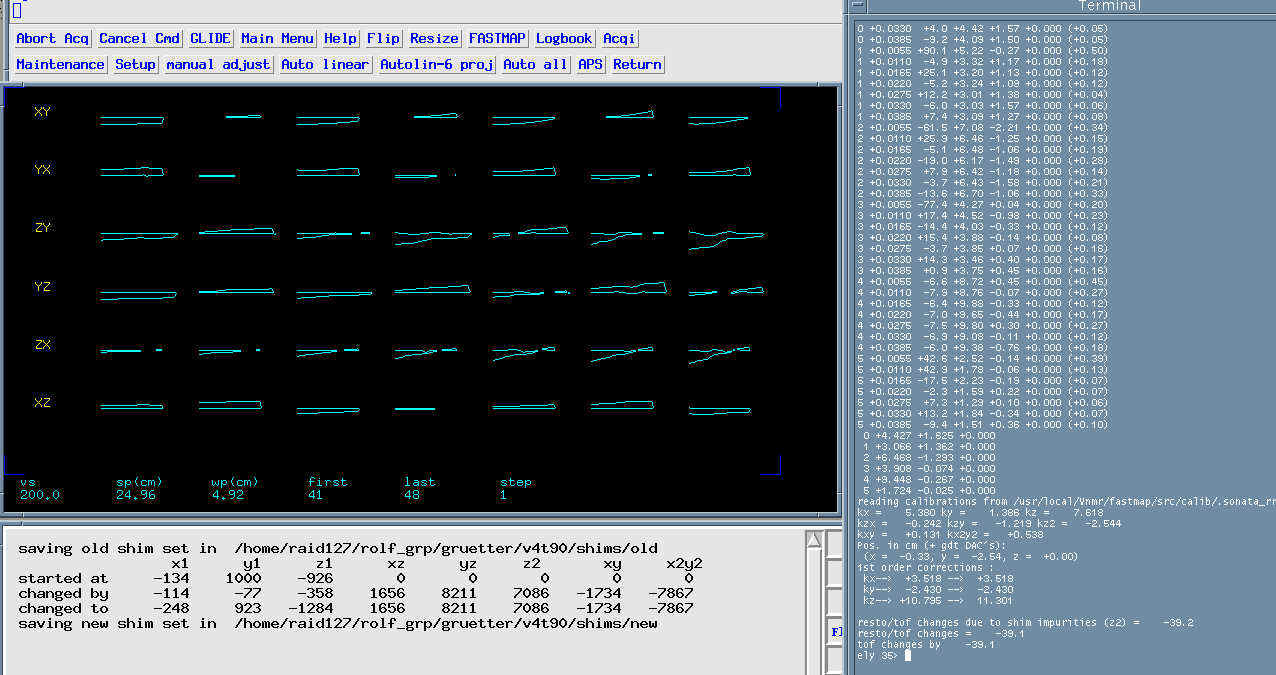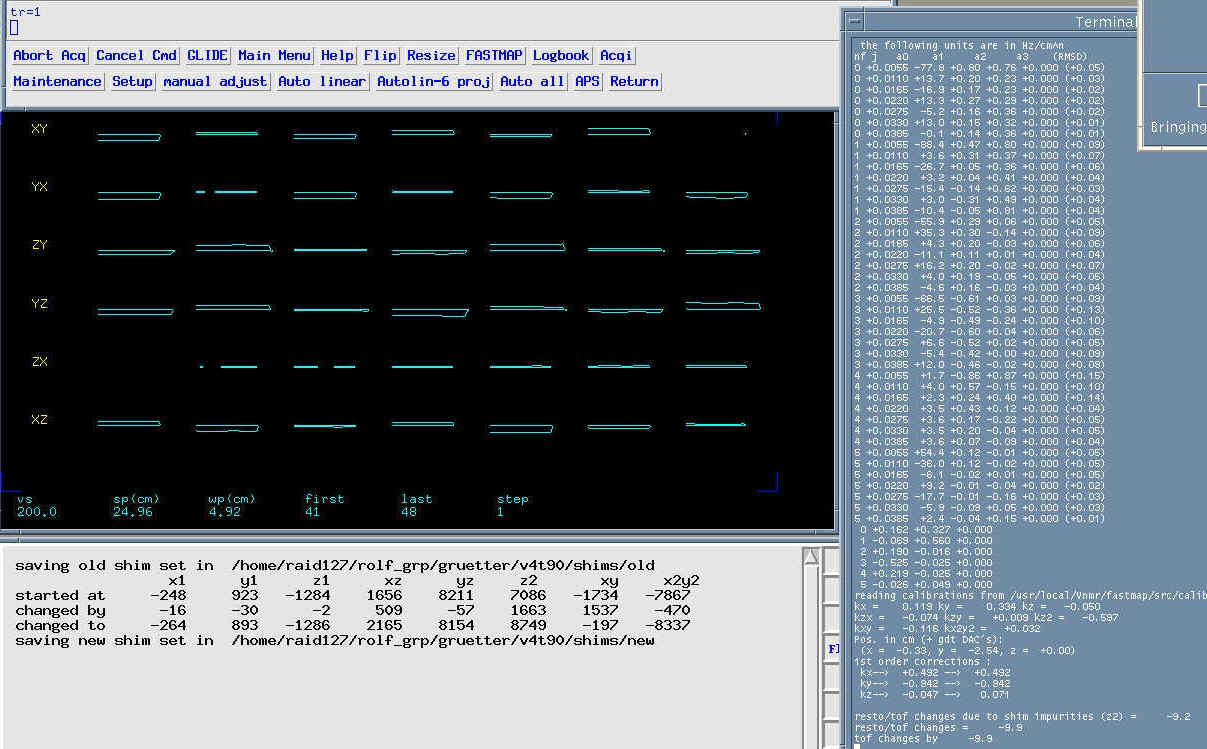
The changes in shim DAC's are displayed in the main text window, the field measurement and some diagnostics are displayed in the shell from which vn was called and the graphics window displays the measured phase profile for the given projection identified by the label, as well as the fit residual.
3. After linear adjustment in APS:

After EPI adjustment of linears in APS, the second orders are adjusted:

After adjustment of second-orders with longer TR (1s):
