MATLAB Basics II
Contents
Examples for "1. Figures and plotting"
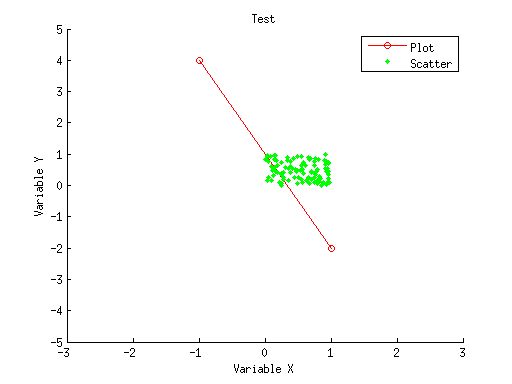
figure;
hold on;
h1 = plot([-1 1],[4 -2],'ro-');
h2 = scatter(rand(1,100),rand(1,100),'g.');
axis([-3 3 -5 5]);
xlabel('Variable X');
ylabel('Variable Y');
title('Test');
legend([h1 h2],{'Plot' 'Scatter'});
print('-dpng','test.png');
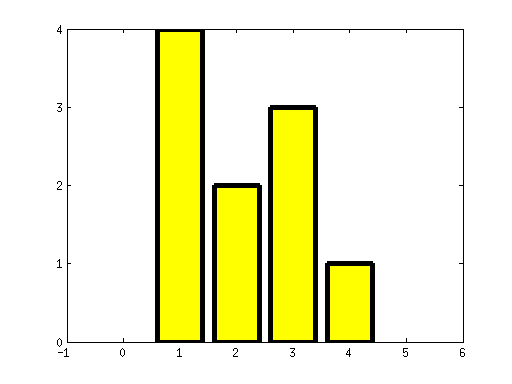
figure;
h1 = bar([4 2 3 1]);
set(h1,'FaceColor','y','LineWidth',4);
ax = axis;
axis([-1 6 ax(3:4)]);
set(gca,'XTick',-1:6);
set(gca,'YTick',0:4);
print('-depsc2','test2.eps');
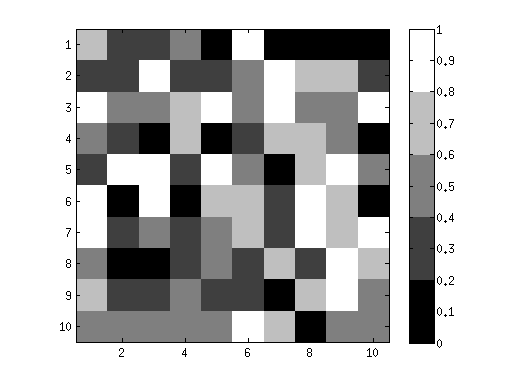
figure;
imagesc(rand(10,10),[0 1]);
axis equal tight;
colormap(gray(5));
colorbar;
Examples for "2. Flow control" and "3. Boolean operators"
a = 2;
if a > 1
  b = 10;
  c = b + 1;
else
  b = 5;
end
b
b =

    10
a = [3 4 5];
if all(a > 0) && length(a)==3
  b = 1;
else
  b = 2;
end
b
b =

     1
cnt = 1;
while cnt < 10
  cnt = cnt * 2;
end
cnt
cnt =

    16
cnt = 0;
for x=1:10
  cnt = cnt + x;
end
cnt
cnt =

    55
for x=1:10
  if x^2 > 50
    break;
  end
end
x
x =

     8
x = 2;
switch x
case 0
  y = x;
case 1
  y = x^2;
case 2
  y = x^3;
end
y
y =

     8
Examples for "7. Function handles, anonymous functions"
a = [1 0];
b = [3 4];
fun1 = @mean;
c = fun1(a) + fun1(b);
c
c =

     4
fun2 = @(x) sum(x.^2);
c = fun2(a) + fun2(b);
c
c =

    26